Table of Contents (TOC)
In the upper left corner, click on  to open the Table Of Contents, briefly TOC from now on, of the map.
The TOC shows all the datasets involved with the Map and allows to manage their properties and representations on the map.
to open the Table Of Contents, briefly TOC from now on, of the map.
The TOC shows all the datasets involved with the Map and allows to manage their properties and representations on the map.
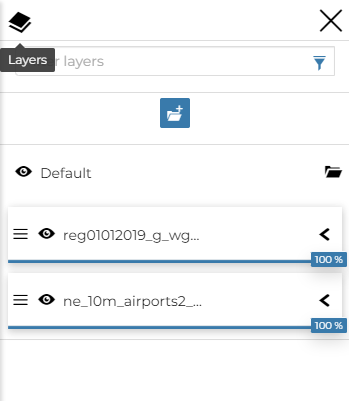
The Table Of Contents (TOC)
From the TOC you can:
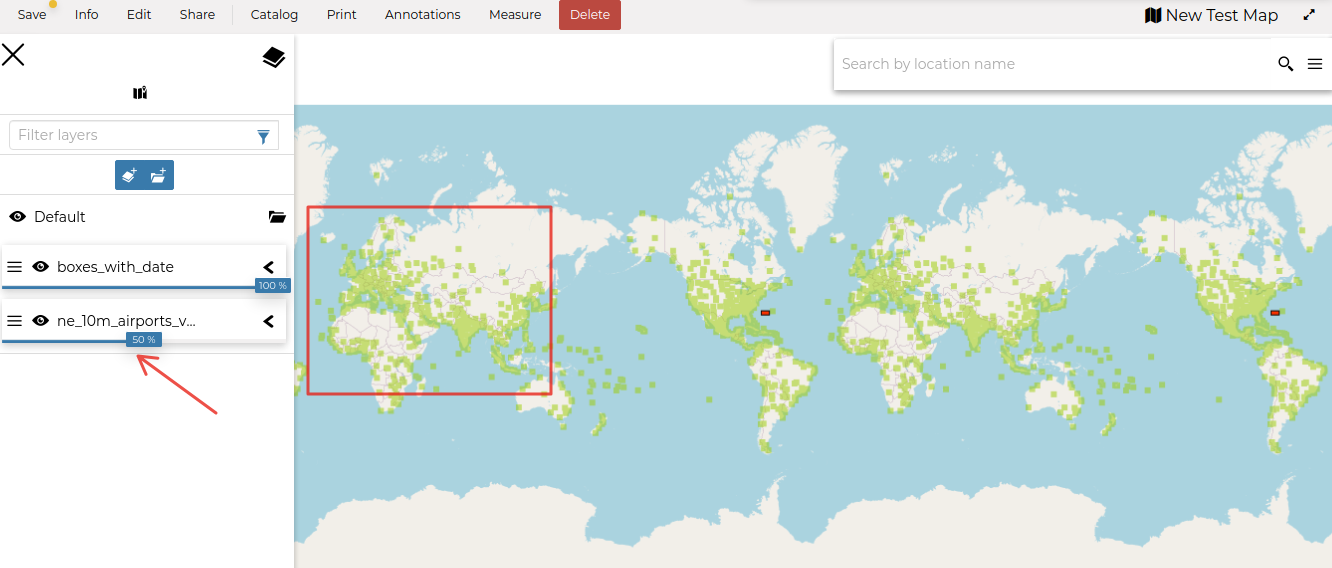
manage the datasets Overlap;
filter the datasets list by typing text in the Filter Datasets field;
manage the datasets properties such as Opacity (scroll the opacity cursor), Visibility (click on
 to make the dataset not visible, click on
  to show it on map);
manage the Dataset Settings, see the next paragraph.
Scrolling the Dataset Opacity
Select a Dataset from the list and click on it, the Dataset Toolbar should appear in the TOC.
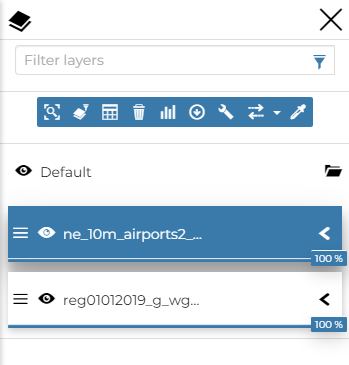
The Dataset Toolbar
The Toolbar shows you many buttons:
the Zoom to dataset extent button allows you to zoom to the dataset extent;
the Filter layer button that acts directly on a layer with WFS available and filter its content;
the Attribute Table button to explore the features of the dataset and their attributes (more information at Attributes Table);
the Delete button to delete datasets (click on Delete Dataset to confirm your choice);
the Widgets button to create Widgets (see Creating Widgets).
the Export data button;
the Settings button drives you through the dataset settings customization (see the next paragraph);
the Compare tool button to Swipe or Spy the selected layer
the Edit Style button;
Managing Dataset Settings
The Dataset Settings panel looks like the one below.
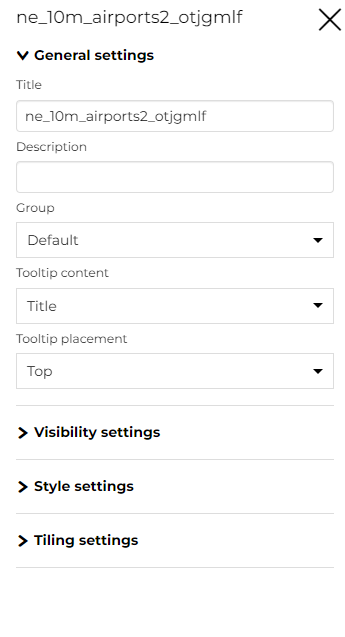
The Dataset Settings Panel
The Dataset Settings are divided in three groups:
General settings
Visibility settings
Style settings
Tiling settings
In the General tab of the Settings Panel you can customize the dataset Title, insert a Description, change/add the Dataset Group and change the Tooltip content and the Tooltip placement.
The Visibility tab where you can Change the Opacity of the layer and add the Visibility limits to display the layer only within certain scale limits
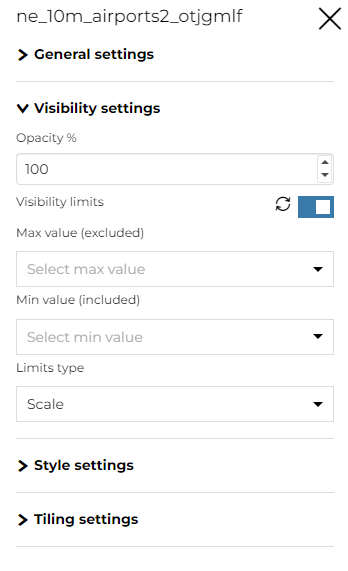
The Visibility tab on Settings Panel
The Style tab allows you to select the style from the available layer styles and change the Width and the Height of the Legend.
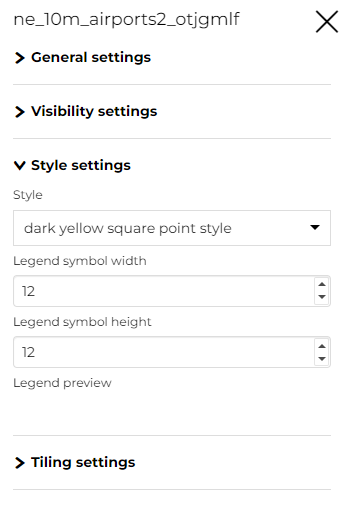
The Style tab on Settings Panel
Click on the Tiling tab to change the output Format of the WMS requests, the Tile Size and enable/disable the Trasparent, the Use cache options and the Single Tile.
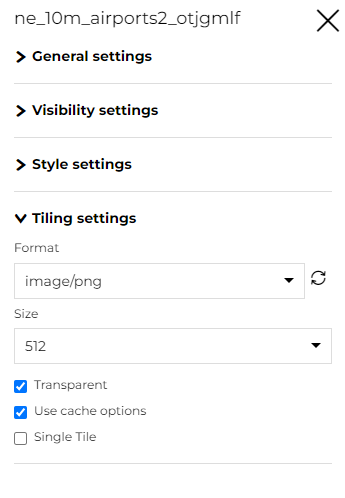
The Tiling tab on Settings Panel